"Tree Line Migration"
Provided by: Jill Pelto Gallery|Published on: May 24, 2024|Last updated: July 16, 2026
Grades: 6, 7, 8, 9, 10, 11, 12
Type: Artwork
Subjects: Earth and Space Sciences, Visual and Performing Arts
Authors: Jill Pelto Gallery
Location: Earth, Europe

This resource has been reviewed by SubjectToClimate's climate scientists and verified for scientific accuracy and up-to-date information. Learn about our review process →
This resource has been reviewed by SubjectToClimate's climate scientists and verified for scientific accuracy and up-to-date information. Learn about our review process →
Synopsis
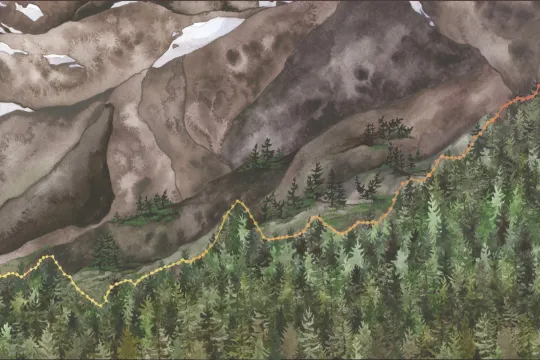
- This watercolor and colored pencil work depicts the potential for the changing habitat zone of the Norway Spruce, using a graph of global temperature data as inspiration for the tree line.
- Students will see how temperatures have shifted and analyze the impact of global climate change on species and their habitats.
Teaching Materials
Positives
- This work is a beautiful combination of ecology, data analysis, and art, inspiring students with various interests.
- The text below the image provides contextual information without being overwhelming for students.
Prerequisites
- Students should understand the causes and impacts of climate change and know how to analyze graphs.
Differentiation & Implementation
- Students can choose a different species from a mountain habitat to research how climate change will impact them.
- After learning about climate impacts in their area, students can look at local tree species and predict how climate change will impact them.
- Students may enjoy watching this video to learn about pika and how climate change impacts animal migration in mountain environments.
- Art students can analyze the work by evaluating the use of color, textures, and light or other criteria.
This resource provides a stunning artist’s depiction of global temperature data since 1880, shown through the lens of artist Jill Pelto’s watercolor Norway spruce forest along a mountain ridge. The temperature data curve follows the tree line and shows in an impactful, visual way how global temperature has climbed as if up a mountain over the last 140+ years. This piece is a useful teaching tool if teachers provide just a quick explanation of what is pictured. This resource is recommended for teaching.
Teaching Tips
Standards
Resource Type and Format
Scientist Reviewed
This resource has been reviewed by SubjectToClimate's climate scientists and verified for scientific accuracy and up-to-date information. Our review process ensures that every resource in our library reflects the current state of climate science.
Learn about our review process →