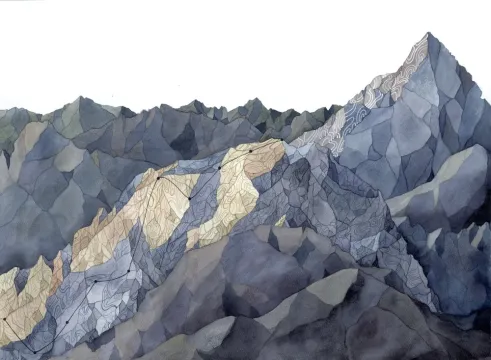
"Progression"
Provided by: Jill Pelto Gallery|Published on: March 7, 2023|Last updated: July 16, 2026
Grades: 6, 7, 8, 9, 10, 11, 12
Type: Artwork
Subjects: Science, Visual and Performing Arts
Authors: Jill Pelto Gallery
Location: North America, North America > United States

This resource has been reviewed by SubjectToClimate's climate scientists and verified for scientific accuracy and up-to-date information. Learn about our review process →
This resource has been reviewed by SubjectToClimate's climate scientists and verified for scientific accuracy and up-to-date information. Learn about our review process →
Synopsis
- This watercolor and colored pencil piece incorporates a data line depicting the increase in use of renewable energy in the United States from 2006-2016.
- The scientific data woven into this landscape artwork shows that there has been progress made in the move toward renewable energy, but we still have a very long way to go.
Teaching Materials
Positives
- This artwork provides an uplifting perspective, as it displays an increase in renewable energy use.
- It is visually dynamic and interesting to observe.
Additional Prerequisites
- Ensure that students are able to read a line graph.
- Teachers should consider how this artwork and single data line could be incorporated into their lessons, as it has many possibilities.
Differentiation
- Art students can use this resource to observe shading, highlights, fine details, and monochromatic coloring schemes.
- For classes that require more background information, consider using this short video about the basics of renewable energy sources or a StC lesson plan introducing renewable energy.
- This art was created in 2016, so have students research renewable energy use in the United States since that year and discuss more recent trends.
- Math classes could research more recent trends and create their own line graphs depicting renewable energy use to the present. Have students calculate how much more renewable energy is being used today.
- Put students in groups to have them discuss how art can be used to display data and to inform the public about important topics, such as climate change.
- Have students read more about Jill Pelto on her website and discuss in groups the purpose of her work and why she might have created this specific piece.
- Consider further exploration of the "Outreach" tab on Jill Pelto's website for opportunities to do a video classroom visit or to use her "Science Friday" link.
- For extension work, consider having students practice using graphs to evaluate the United States's renewable energy use compared with other countries.
This is a website containing the artwork of a scientist that studies climate change. This resource could be helpful in explaining that art also conveys a message and that through art, knowledge about climate change can be passed on. This is recommended for teaching.
Teaching Tips
Standards
Resource Type and Format
Scientist Reviewed
This resource has been reviewed by SubjectToClimate's climate scientists and verified for scientific accuracy and up-to-date information. Our review process ensures that every resource in our library reflects the current state of climate science.
Learn about our review process →