"Gulf of Maine Temperature Variability"
Provided by: Jill Pelto Gallery|Published on: April 27, 2021|Last updated: July 16, 2026
Grades: 6, 7, 8, 9, 10, 11, 12
Type: Artwork
Subjects: Biology, Visual and Performing Arts
Authors: Jill Pelto Gallery
Location: North America, North America > United States, North America > United States > Maine

This resource has been reviewed by SubjectToClimate's climate scientists and verified for scientific accuracy and up-to-date information. Learn about our review process →
This resource has been reviewed by SubjectToClimate's climate scientists and verified for scientific accuracy and up-to-date information. Learn about our review process →
Synopsis
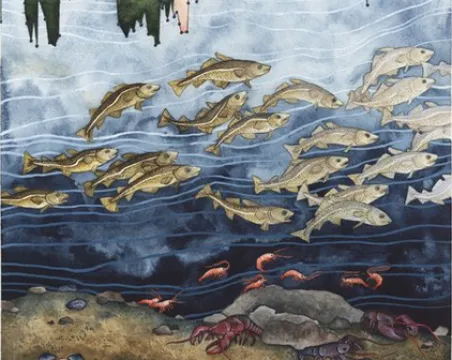
- This watercolor painting by scientist and artist Jill Pelto uses ocean temperature data from the last 15 years to show the various effects of rising temperatures and human activities on the marine environment in the Gulf of Maine.
Teaching Materials
Positives
- Students use their creative skills to "think outside of the box" and interpret the data in this artistic image.
- The description below the image details the elements of the artwork and their connection to the graph displayed.
Prerequisites
- Students should be familiar with the terms temperature fluctuations, ocean acidification, overfishing, and species.
Differentiation & Implementation
- In art classes, students can use this as an example of a watercolor and colored pencil art piece.
- A math teacher can share this resource with students when learning about graphs, and students could make their own artistic graphs using the data linked in the citation or from another source.
- This image can be used as a hook for lessons about climate change, coastal ecosystems, or population dynamics.
The resource displays climate variability and other influences on marine resources and habitat. Anthropogenic activities have accelerated climate change impacts on marine ecosystems. This is recommended for teaching.
Teaching Tips
Standards
Resource Type and Format
Scientist Reviewed
This resource has been reviewed by SubjectToClimate's climate scientists and verified for scientific accuracy and up-to-date information. Our review process ensures that every resource in our library reflects the current state of climate science.
Learn about our review process →