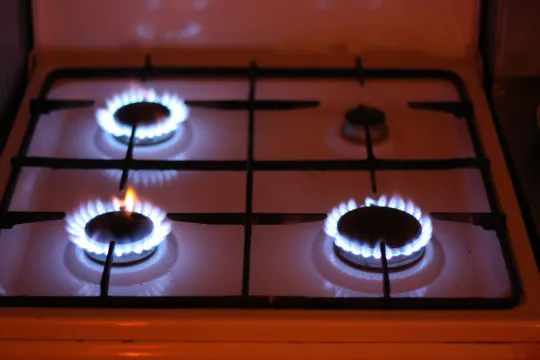
Gas Consumption
Provided by: Our World in Data|Published on: July 20, 2021|Last updated: July 16, 2026
Grades: 6, 7, 8, 9, 10, 11, 12
Type: Data, Graphs, and Maps
Subjects: Science, Mathematics
Authors: Hannah Ritchie, Max Roser
Location: Earth

This resource has been reviewed by SubjectToClimate's climate scientists and verified for scientific accuracy and up-to-date information. Learn about our review process →
This resource has been reviewed by SubjectToClimate's climate scientists and verified for scientific accuracy and up-to-date information. Learn about our review process →
Synopsis
- Using this interactive resource from Our World in Data, students will use a graph, map, and table to see global gas consumption separated by country or region.
- Students can see data as far back as 1965, and it is measured in terawatt-hours.
Teaching Materials
Positives
- The provider updates this data regularly.
- Students can also easily hide irrelevant data to focus on the data they need.
Prerequisites
- Students should know how to interpret data and read maps and graphs.
- Some students may need some background information about natural gas and help to understand the difference between natural gas and gasoline.
Differentiation & Implementation
- Science classes can use this data after learning about the harmful impacts of natural gas use and extraction. The media literacy activity Natural Gas: Water & Climate Impacts can help facilitate this topic.
- Social studies classes can discuss the environmental justice aspects associated with natural gas extraction. Students can watch the Youth Climate Story: Fracking in Pennsylvania for a case study of this.
- In math classes, students can download the table to practice manipulating the data in Excel or Google Sheets.
Energy consumption from gas is more common in the USA, hence the high value in the chart. This resource will enable students to explore and get insights when comparing the USA with other countries. The datasets and methods are accurate, and there is no contradiction. The resource is recommended for teaching.
Teaching Tips
Standards
Resource Type and Format
Scientist Reviewed
This resource has been reviewed by SubjectToClimate's climate scientists and verified for scientific accuracy and up-to-date information. Our review process ensures that every resource in our library reflects the current state of climate science.
Learn about our review process →