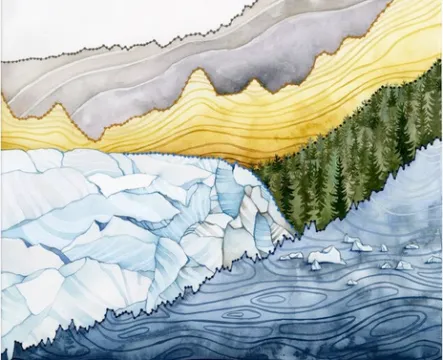
"Currents"
Provided by: Jill Pelto Gallery|Published on: April 27, 2021|Last updated: July 16, 2026
Grades: 6, 7, 8, 9, 10, 11, 12
Type: Artwork
Subjects: Science, Visual and Performing Arts
Authors: Jill Pelto Gallery, Jill Pelto
Location: Earth

This resource has been reviewed by SubjectToClimate's climate scientists and verified for scientific accuracy and up-to-date information. Learn about our review process →
This resource has been reviewed by SubjectToClimate's climate scientists and verified for scientific accuracy and up-to-date information. Learn about our review process →
Synopsis
- This painting by scientist and artist Jill Pelto incorporates graphs of CO2 emissions, renewable energy consumption, sea level rise, temperature, and land ice.
- The painting was created for the cover of the July 2020 Climate issue of TIME magazine.
Teaching Materials
Positives
- Students may see how graphs can have more than one use.
- Pelto showcases alternative ways of using data to make a point that is instantly relatable to a broad spectrum of people that may not relate to standard graphed data results.
Additional Prerequisites
- Students need to understand how to read a graph.
- The resource includes links to the datasets used for each graph.
Differentiation
- Art classes can use this as an example of line, composition blocking, and graphic labeling/symbolism.
- Students can discuss how artwork can be used to inform the public on important issues such as climate change.
- As a cross-curricular connection, math classes can use this to show the relevance of mathematical concepts in both scientific and artistic disciplines.
The resource presents scientific evidence for students to explore the trend of CO2 and note the changes caused by human activities. Data source is valid and the resource is recommended.
Teaching Tips
Standards
Resource Type and Format
Scientist Reviewed
This resource has been reviewed by SubjectToClimate's climate scientists and verified for scientific accuracy and up-to-date information. Our review process ensures that every resource in our library reflects the current state of climate science.
Learn about our review process →