• Views 177
  • Favorites
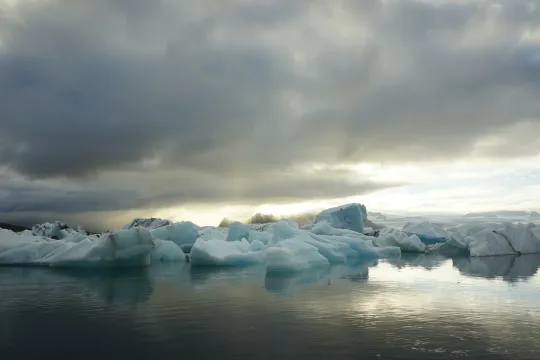
Photo by Tom Robertson via Unsplash

Database Provider

Author

My NASA Data

Grades

6th, 7th, 8th, 9th, 10th, 11th, 12th

Subjects

Science, Biology, Earth and Space Sciences

Resource Types

  • Lesson Plans
  • Interactive Media
  • Worksheets
  • Videos, 4 minutes, 52 seconds, CC, Subtitles
  • Videos, 1 minute, 39 seconds, CC, Subtitles
  • Videos, 57 seconds, CC, Subtitles
  • Videos, 2 minutes, 25 seconds, CC, Subtitles
  • Videos, 4 minutes, 28 seconds, CC, Subtitles

Regional Focus

Global, Polar Regions

Format

Jamboard, Google Docs, PDF, Google Forms

Sea Ice and the Earth System Story Map

|
Ask a Question

Synopsis

  • In this lesson, students learn about changes in sea ice extent through videos, animations, interactive simulations, and guiding questions.
  • By the end of the lesson, students build a fact-based argument connecting sea ice extent to warming global temperatures and the different spheres within the Earth system.

Teaching Tips

Positives

  • The interactive data resources and supporting videos are excellent in quality and fun to use.

  • Each section of the lesson (engage, explore, explain, elaborate, evaluate) clearly demonstrates connections between sea ice extent and climate change.

  • The final graphic organizer activity provides an opportunity for students to collectively review and discuss their understanding of sea ice and climate trends.

Additional Prerequisites

  • This lesson is designed for classrooms with 1:1 or 1:2 technology.
  • The lesson is intended to take two 50-minute class periods to complete.
  • The lesson includes a PDF teacher guide, a Google Doc student worksheet, a Google Jamboard, and five Google Forms.
  • In addition to the five videos, there are numerous animations used throughout the lesson.
  • Students should be familiar with the relationship between solution concentration and density.
  • Students should be able to find coordinates on a map, read line graphs, and identify trends in data.

Differentiation

  • Students can work independently or in pairs.
  • This is an excellent resource for teaching virtual or blended learning because students work through the lesson independently and at their own pace.
  • Students can complete the guiding questions on a printed worksheet, on the Google Doc, or in the five Google Forms (one for each section of the lesson). Using Google Forms allows teachers to easily view aggregate responses and identify common misconceptions or points of confusion.
  • This lesson can be used in biology classes when learning about habitat changes, adaptation, and migration due to climate change.

Scientist Notes
The resource will help students explore the seasonal changes in Sea Ice using a time series data and make logical and valid conclusions on the changes over time. This resource has no contradiction in data outputs and it is recommended for teaching.
Standards
  • Next Generation Science Standards (NGSS)
    • ESS2: Earth's Systems
      • MS-ESS2-6 Develop and use a model to describe how unequal heating and rotation of the Earth cause patterns of atmospheric and oceanic circulation that determine regional climates.
      • HS-ESS2-1 Develop a model to illustrate how Earth’s internal and surface processes operate at different spatial and temporal scales to form continental and ocean-floor features.
      • HS-ESS2-2 Analyze geoscience data to make the claim that one change to Earth’s surface can create feedbacks that cause changes to other Earth systems.
    • ESS3: Earth and Human Activity
      • HS-ESS3-5 Analyze geoscience data and the results from global climate models to make an evidence-based forecast of the current rate of global or regional climate change and associated future impacts to Earth systems.
  • Related Resources

    Reviews

    Login to leave a review