This article is very brief and can be both read and discussed during class.
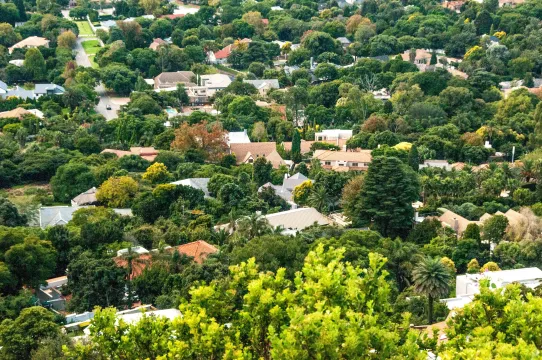
The maps at the beginning of the reading do an excellent job of illustrating the relationship between tree cover and surface temperature.
Prerequisites
Students should understand climate change and its impacts before reading.
Students should know how to analyze maps.
Differentiation & Implementation
To take a more inquiry-based approach, teachers can begin by having students analyze the images at the beginning of the article, without showing the heading above. Teachers can have students take note of what they notice and what they wonder about the connection between tree cover and surface temperature.
Teachers can make connections to civics and history by taking time to discuss racism and historical redlining that lead to a disproportionate amount of people of color living in neighborhoods with less tree cover. This lesson does a great job of explaining this.
Teachers can have students discuss how planting trees in neighborhoods with poor tree cover can help contribute to the Sustainable Development Goals, especially Goal 3, Good Health and Well-Being, and Goal 10, Reduced Inequalities.
To deepen the connections to climate change, teachers can launch into a discussion about the increasing importance of cooling down neighborhoods in the face of climate change and how trees sequester carbon.
Scientist Notes
Teaching Tips
Standards
Resource Type and Format
Related Teaching Resources
All resources can be used for your educational purposes with proper attribution to the content provider.