Some resources from federal government sites are currently unavailable; when possible, we’ve provided alternative non-government links to ensure continued data access.
Provided by: MIT Climate Action Through Education |Published on: February 4, 2025
Lesson Plans
9101112
Synopsis
In this lesson, students will explore sea level rise data, learn about the difference between melting ice on land versus water, explain the correlation coefficient (R), and graph the data over time to look at the y-intercept and slope.
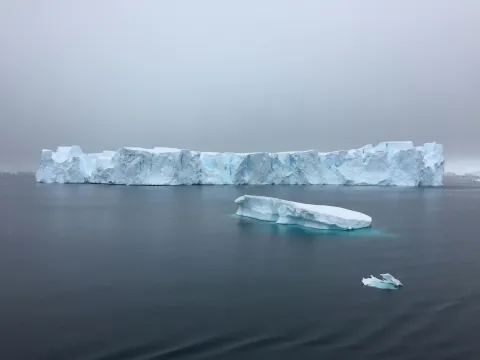
Students will learn how melting sea ice is an indicator of climate change, how scientists measure sea ice, and the impact of feedback loops.
The questions in the student worksheet invite students to use critical thinking and analysis skills.
The resource includes guidance for teaching this topic through SEL and place-based learning lenses.
Prerequisites
Students will need to download the basic (free) version of Vernier Graphical Analysis or have access to graphing calculators.
There are resources linked in the lesson to support student knowledge of the basics of climate change.
Differentiation & Implementation
When watching the video, some students may benefit from pausing or slowing the video to read the text. Teachers can also play the video for the class and read the text aloud.
After completing this lesson, students can discuss the impact of land ice melt on sea level rise and, consequently, coastal communities.
To help students understand the differences between sea ice and land ice with a hands-on activity, teachers can use the resource, Is Ice, Ice Baby?, which includes videos and experiments.
Scientist Notes
Teaching Tips
Standards
Resource Type and Format
Related Teaching Resources
All resources can be used for your educational purposes with proper attribution to the content provider.