Trees and Paleoclimate Lab

This resource has been reviewed by SubjectToClimate's climate scientists and verified for scientific accuracy and up-to-date information. Learn about our review process →
Provided by: TERC|Published on: September 30, 2022
VideosScientist Reviewed
9101112AP
Scientist Reviewed This resource has been reviewed by SubjectToClimate's climate scientists and verified for scientific accuracy and up-to-date information. Learn about our review process →
Synopsis
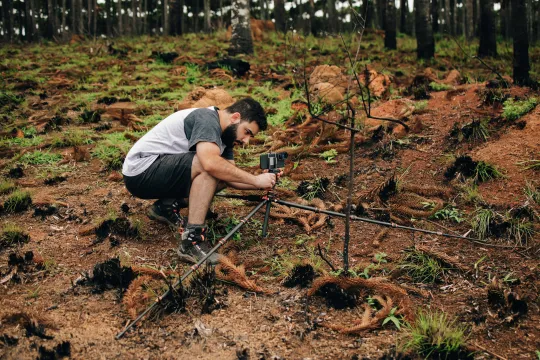
- In this three-part lab, students learn about the study of ancient climates through a variety of interactive activities, short readings, videos, comprehension questions, and a hands-on lab.
- Students will discover what single-celled forams can teach us about past climates through isotopic analysis and the final pollen and paleoclimate lab activity will get them digging in the dirt and applying their knowledge.
- Students will also gain a first-hand understanding of data collection, research, and the scientific method.
Subjects: Chemistry, Biology, Earth and Space Sciences, Mathematics
Authors: TERC, Science Education Resource Center at Carleton College (SERC)
Region: North America, Global
Languages: English
Teaching Materials
Positives
- This resource is a great way to learn about how scientists "know what they know" and how they draw conclusions about climate variation over thousands and millions of years in the past.
- The lab activity is a hands-on activity to get students moving and working together.
Additional Prerequisites
- The lab activity requires materials such as plates, tweezers, soil, and beads.
- Students should be familiar with terms like climate, sediment, and weather and know how to read a 3-axis graph.
- The slideshow presentation in part A cannot be made full size on the screen but it can be downloaded as a MS PowerPoint file.
Differentiation
- Part A includes optional extension resources such as articles and videos on ice cores, tree rings, and other natural recorders of climate variability for students who want to learn more about paleoclimatology.
- Although considered optional extensions, the videos at the end of part A follow scientists in the field and could help students draw similarities between their lab activity and the work scientists do.
- Chemistry classes could use this lab for lessons about isotopes, atomic structure, mass spectrometry, or practical applications of chemistry.
- Other resources to consider on this topic include this resource on studying past climates through tree rings and this resource on looking at future climates.
In this resource, students will investigate past climate using proxy data, which is useful to model future climate projections. There are no scientific misconceptions in the resource. Above all, this resource is recommended for teaching.
Teaching Tips
Standards
Resource Type and Format
About the Partner Provider
Technical Education Research Centers (TERC)
Technical Education Research Centers (TERC) is an independent research-based nonprofit organization. They are dedicated to inspiring and engaging learners through stimulating research, materials and tool development, and professional development.
Scientist Reviewed
This resource has been reviewed by SubjectToClimate's climate scientists and verified for scientific accuracy and up-to-date information. Our review process ensures that every resource in our library reflects the current state of climate science.
Learn about our review process →


