• Views 17
  • Favorites
Photo by Hans via Pixabay

Database Provider

Authors

CLEAN, The Ohio State University

Grades

6th, 7th, 8th, 9th, 10th, 11th, 12th, AP® / College

Subjects

Science, Social Studies, Earth and Space Sciences, Geography

Resource Types

  • Video, 3 minutes, 33 seconds, CC
  • Interactive Media
  • Data

Regional Focus

Global

Fluid Earth Viewer

|
Ask a Question

Synopsis
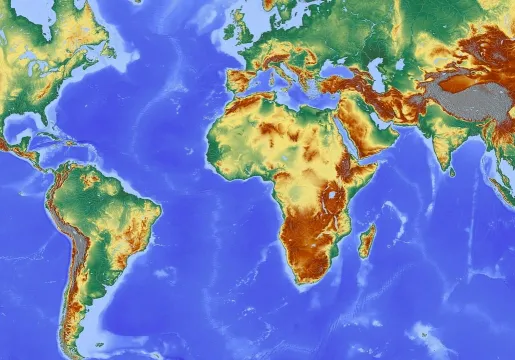
  • This interactive map displays real-time surface temperatures and other data worldwide.
  • Students will learn about up-to-date information, such as weather, the ocean, and the climate, through a helpful sidebar with tabs for variables and several projection choices.
  • Students can also travel in a virtual "time machine" to view data from other years.
Teaching Tips

Positives

  • There are many views to select from, which provide various projections such as globe, wall map, Arctic, Antarctic, and more.
  • Students can click on datasets, such as weather, ocean, and climate, and then choose variables within those datasets. 

Additional Prerequisites

  • "Time machine" links before 2021 only work for the climate dataset and don't include future projections.
  • The website can be shared via social media.
  • Teachers and students will need internet access.

Differentiation

  • Math teachers can utilize the resource for lessons about latitude and longitude. 
  • Social studies classes can "pin" various international cities and also "pin" their home cities during a lesson about cultures.
  • English teachers can have students manipulate the interactive map and write an informational paragraph about their discoveries.
  • Some students may need guidance or a cheat sheet to help them navigate the resource.
  • Have students select the climate dataset and use the "Time Machine" function to see how surface temperatures have shifted over time.
Scientist Notes
This resource, compiled by CLEAN and developed by the Climate Research Center at Ohio State University, is an interactive earth model where students can view the daily temperature, wind, humidity, precipitation, and other variables in real-time. In addition to real-time data, a "time machine" option is available for students to compare data from previous days/weeks/years. This interactive "fluid earth" is a wealth of climate and weather data that can be viewed or downloaded as datasets to be analyzed and graphed.
Standards
  • Next Generation Science Standards (NGSS)
    • ESS2: Earth's Systems
      • MS-ESS2-5 Collect data to provide evidence for how the motions and complex interactions of air masses results in changes in weather conditions.
      • MS-ESS2-6 Develop and use a model to describe how unequal heating and rotation of the Earth cause patterns of atmospheric and oceanic circulation that determine regional climates.
      • HS-ESS2-1 Develop a model to illustrate how Earth’s internal and surface processes operate at different spatial and temporal scales to form continental and ocean-floor features.
    • ESS3: Earth and Human Activity
      • HS-ESS3-5 Analyze geoscience data and the results from global climate models to make an evidence-based forecast of the current rate of global or regional climate change and associated future impacts to Earth systems.
  • College, Career, and Civic Life (C3) Standards
    • Dimension 2: Geography
      • D2.Geo.2.6-8 Use maps, satellite images, photographs, and other representations to explain relationships between the locations of places and regions, and changes in their environmental characteristics.
      • D2.Geo.3.9-12 Use geographic data to analyze variations in the spatial patterns of cultural and environmental characteristics at multiple scales.
  • Common Core Math Standards (CCSS.MATH)
    • Number & Quantity: Quantities (9-12)
      • CCSS.MATH.CONTENT.HSN.Q.A.3 Choose a level of accuracy appropriate to limitations on measurement when reporting quantities.
  • Related Resources

    Reviews

    Login to leave a review